rt-observe & the Toolkit Dashboard
Chapter 07 of the ResearchTools manual. Back to table of contents. Skill row: 04-skills.md. Command summary: 08-commands.md.
What it answers
Answers one question: is this toolkit correctly deployed to every harness in use, and which
empty mirror cells are deliberate rather than lost. Serves the same snapshot as a loopback
dashboard (/rt-dashboard, rt-dashboard.ps1/.sh/.bat) - mirror matrix, fan-out wiring
diagram, Real-Time Process tab, sessions strip, and the rail's seven receipt-bearing panels
(repository, plan, services, code graph, hooks, journal, actions - the last a closed, tested
action whitelist, dry-run by default). The journal panel (2026-09-24) reads an OPTIONAL,
absent-by-default persistence layer - PostgreSQL identity/account-mapping plus an OpenObserve
trace/audit stream - that changes nothing about a clone with neither configured.
Full reference (states, dashboard layout, actions panel, session messaging, adapters): docs/rt-observe.md.
Screenshot
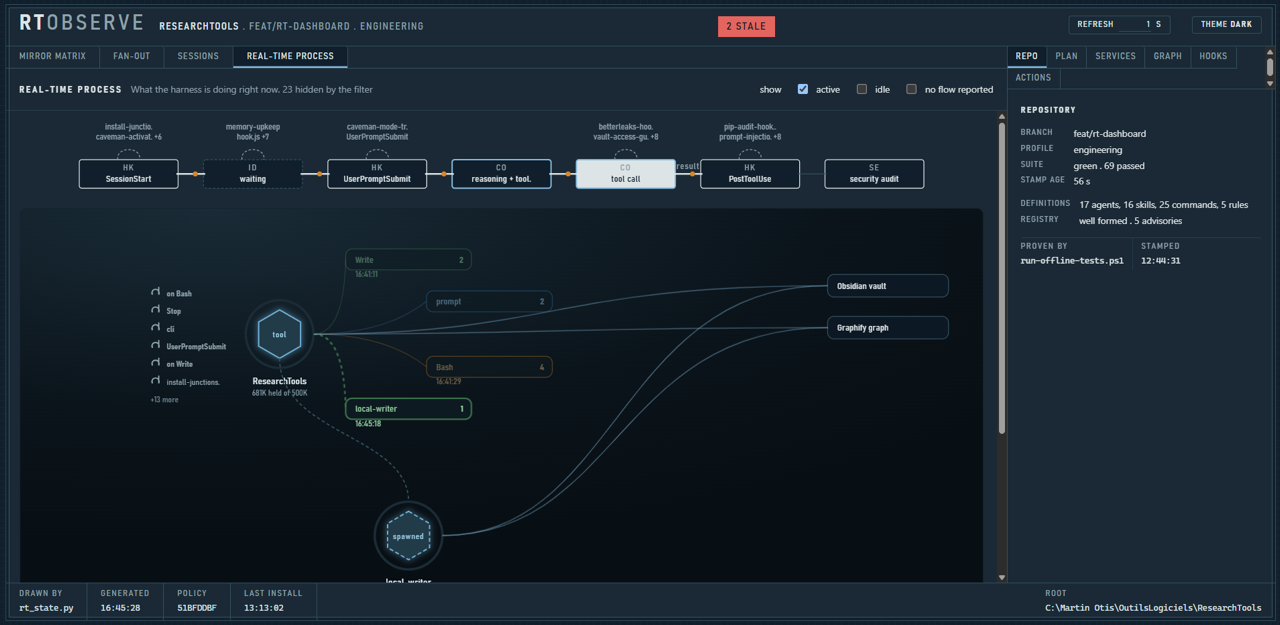
The Real-Time Process tab (one of the four left-side views, alongside Mirror Matrix,
Fan-out, and Sessions), captured on branch feat/rt-dashboard, profile engineering. The top
strip walks the harness state machine for the current turn — SessionStart → waiting →
UserPromptSubmit → reasoning + tool → tool call → PostToolUse → security audit — with
the hooks firing at each step named above their box (install-junctions, memory-upkeep,
caveman-mode-tr..., betterleaks-hoo..., pip-audit-hook...). Below it, the fan-out diagram
draws one turn's actual calls: the tool node branching into Write, prompt, and Bash
counts, out to Obsidian vault and Graphify graph as the two memories, and down to a
spawned local-writer subagent — this is the "runner" the tests describe travelling a live
edge. The right rail shows the Repository panel (branch, profile, suite status green .
69 passed, stamp age, definitions count, registry health, and run-offline-tests.ps1 as the
prover), with Plan, Services, Graph, and Hooks as sibling tabs. The 2 STALE
badge top-right and the footer strip (drawn by rt_state.py, generation timestamp, policy
hash, last install, repo root) are the receipts every panel here carries per R9 — a claim with
no stamp is not trusted.
The /rt-dashboard command
Starts the rt-observe dashboard on loopback and reports the URL. With no argument it dry-runs
first, which names the interpreter it resolved, the bind address, the page and every per-section
TTL, and starts nothing. With --json it skips the server entirely and dumps the snapshot,
which is the right form inside a script or when the only question is whether anything is lost.
Its three refusals are read back to you rather than worked around: no interpreter found names every candidate tried and exits 2; a port held by something else names the holding PID and exits 1, because two dashboards showing two different snapshots is worse than none; and a dashboard already running is reported with its URL rather than started twice.
The command is a convenience, never the only way in. rt-dashboard.ps1, rt-dashboard.sh,
rt-dashboard.bat and the VS Code task all reach the same launcher without Claude Code.
File: .claude/commands/rt-dashboard.md
← 06 Aider nightly pipeline | Table of contents | 08 Commands →